Announcing our new A/B Testing & Experimentation Platform for Feature Flags
Victor Vucicevich
7/16/2023
DevCycle has released analysis functionality to enable powerful Experimentation and A/B Testing capabilities along with robust metrics reporting, giving all users of the platform the ability to view an analysis of the impact of their feature releases.
Any number of metrics can be attached to a feature, allowing for an in-depth analysis of the overall impact of a feature as it is released. Data will be presented in real-time, giving teams the ability to understand how feature releases affect KPIs and test modifications on the flow for real data-driven decision-making.
How Experimentation Benefits You
Experimentation is crucial for testing modifications to your product. You may investigate which changes result in the best outcomes. Also known as split testing, A/B testing multivariate testing, or comparative analysis depending on who you ask, the only thing that matters is that you can tie KPIs to your feature flags and understand the impacts of your code change.
Experimentation can be used to test new features, design changes, marketing campaigns, or anything that could potentially impact how a product or service is used. Teams use experimentation today for these real-world scenarios.
Real-World Use Cases
- A major new feature is released behind a flag and is measured against premium subscription conversions, validating whether or not the new feature is improving revenue or not.
- An infrastructure refactor is distributed to an initial set of users, with error rates tracked to ensure the intended improvement is actually observed.
- A new SDK can be released while tied to response time and latency metrics, ensuring user experience is maintained or improved while adding new tooling.
You've probably been experimenting without knowing it. For instance, you likely compare the before and after to review changes whenever you release something. When combined with Feature Flagging, DevCycle is able to give insights into key metrics on a feature's performance during release, allowing you to react and make changes accordingly.
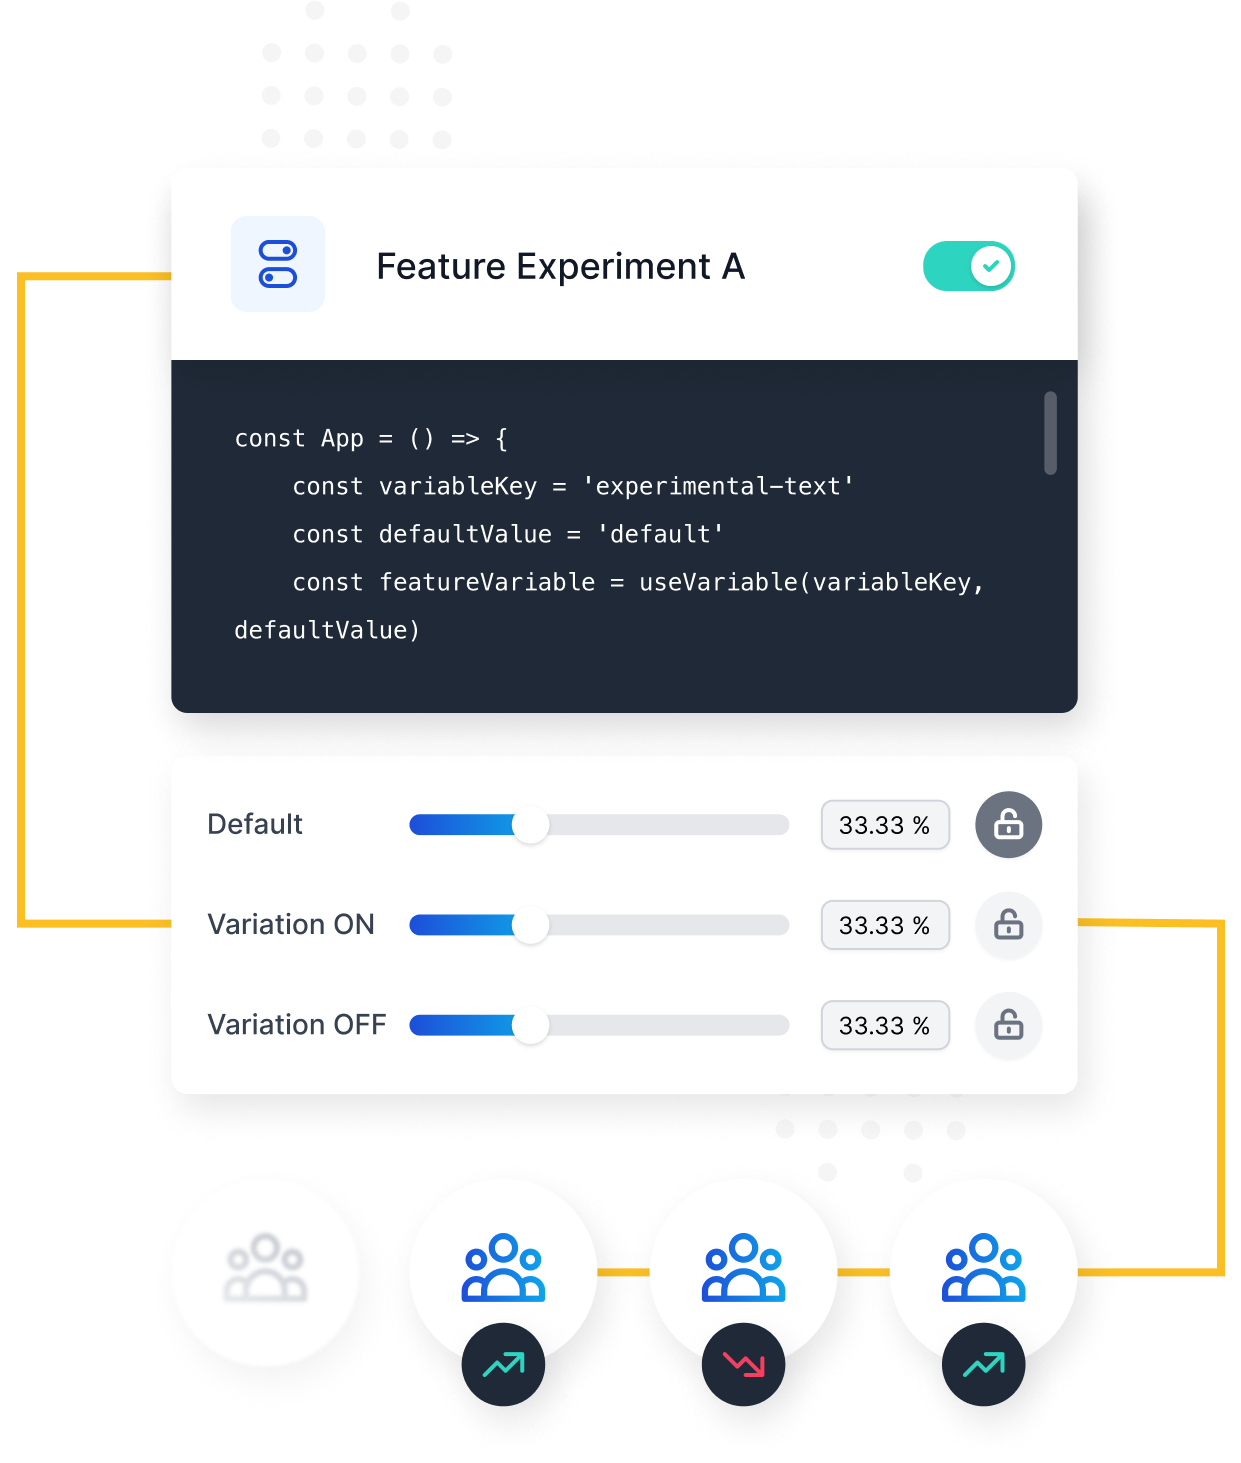
Of course, your team isn't restricted to a simple on or off approach. Using DevCycle, your team can deliver multiple variations simultaneously, giving an even broader view of which variations are performing the strongest.
Making Changes and Reacting in Real-Time
-4.png)
Typically, when a feature is deployed, it is simply live and in production for your entire user base while your team is confined to watching charts in your chosen reporting platform and doing a major revert if necessary. When releasing a feature via a feature flag, however, your team can selectively choose how, when, and why a feature is actually presented to a user.
With this type of power, teams are able to gradually rollout a feature release, or selectively decide who should receive the new functionality as an experiment, and then view the metrics as it rolls out in real-time. With DevCycle you can choose to randomly (or specifically) split traffic and give some people the new feature, and hide it from everyone else.
Any metrics can be re-used numerous times across features, so your most important ones will always be available for analysis on each feature. They can also be easily created and attached to any feature. So, when releasing a new feature, attach your metrics to it even before it is released, and your team will be able to watch the impact in real-time.
With visualization of each metric, your team will be able to interpret metrics, and instantly react and make changes on the fly to ensure that KPIs aren't negatively impacted by new releases. If anyone sees a negative impact during a release of a new feature, they can very easily toggle the feature off or simply reduce the number of users exposed to it, all within the same, simple interface.
Finding Unintended Impacts
An unlimited number of metrics can be associated with any feature, metrics can be re-used across features and they can also be associated with multiple features. This gives the opportunity to catch impacts on metrics that may have originally been thought to have no relation to a feature at all!
For example, your team can create a simple "API service latency metric" which tracks the response times for your main APIs. Typically, this metric would be attached to any feature that directly interacts with your API service. However, due to the global nature of DevCycle metrics, you will be able to see if a feature entirely unrelated to your API service has had an impact on your response times.
How does it work?
To calculate metrics, DevCycle uses the custom events sent via its API or SDKs. Each event has the information of which user sent it, and which Feature and Variation they were experiencing at that time.
For optimal experiments, use Features with variations which are randomly distributed across variations.
Using these events, DevCycle uses two methods to calculate the statistical significance of metrics to evaluate your experiments:
- Z-Score - is used for binary conversion goals such as button clicks or conversion goals
- Two-Tailed T-Test - is used for value optimization goals where the comparison is the difference between two average values
Both methods test for a 95% confidence interval against the control variation.
There is some nuance to each metric depending on the type. Head over to the DevCycle Documentation to learn more.
Get Started Now
DevCycle's new experimentation and A/B testing capabilities give teams the power to release, test, and measure features in real-time. This allows for a more flexible and data-driven approach to releasing features that can minimize negative impacts on KPIs.
So get started now! Create metrics and attach them to Features to get a pulse on the impact of each new feature release. Use these metrics to ensure that the best experience is being delivered to your users and that nothing is going awry anywhere in your system!
Written By
Victor Vucicevich